


Carbon Emissions & Reduction Plan Report 2025
1. Overview
1.1. Purpose
Personal Homecare Pharmacy (PHP) is committed to achieving Net Zero emissions by 2050.
To help achieve this, we engaged Auditel, a third-party Carbon Specialist, to calculate our carbon footprint emissions for the period 01-Jan-2025 to 31-Dec-2025.
We include all seven Kyoto Protocol Greenhouse Gas groups in our emissions calculations. This Carbon Reduction Plan has been completed in accordance with PPN 006 and the associated guidance and reporting standard for Carbon Reduction Plans.
1.2. Scope
This is PHP’s PPN 006 Carbon Emission & Reduction Plan Report for the calendar year 2025.
2. Contents
3. Definitions
| Abbreviation / Acronym / Word | Definition / Meaning |
|---|---|
| Baseline Emissions | Baseline emissions are the recorded greenhouse gases produced by an organisation for the year indicated prior to the introduction of any strategies to reduce emissions. Baseline emissions act as the reference point against which future emissions reduction can be measured. |
| Corporate Value Chain Standard | The GHG Protocol Corporate Value Chain (Scope 3) Standard is a Greenhouse Gas (GHG) Protocol standard that provides a globally recognised framework for organisations to measure, manage, and reduce indirect (Scope 3) emissions across their entire value chain. |
| ESG | ESG (Environmental, Social and Governance) is a framework used to assess how responsibly an organisation manages its environmental impact, social relationships, and corporate governance practices. |
| GHG Reporting Protocol | The GHG Protocol Reporting Protocol is a globally recognised standard that provides organisations with a consistent framework to measure, report, and manage greenhouse gas emissions across their operations and value chain. |
| PPN 006 | PPN 006 is a UK Government procurement policy that requires suppliers bidding for major public contracts to demonstrate a credible carbon reduction plan aligned with the UK’s net-zero targets. |
| SECR | SECR (Streamlined Energy and Carbon Reporting) is a UK reporting framework that requires qualifying organisations to disclose their energy use, greenhouse gas emissions, and related efficiency actions within their annual reports. |
| tCO2e | tCO2e (tonnes of carbon dioxide equivalent) is a standard unit used to compare and aggregate the climate impact of different greenhouse gases by expressing them as an equivalent amount of CO2 based on their global warming potential. |
4. References
Cabinet Office. (2025). Procurement Policy Note 006: Taking account of Carbon Reduction Plans in the procurement of major government contracts (Updated February 2025). UK Government Guidance.
Department for Energy Security and Net Zero & Department for Business, Energy & Industrial Strategy. (2025). Government Conversion Factors for Company Reporting of Greenhouse Gas Emissions: Greenhouse Gas Reporting: Conversion Factors 2025. UK Government.
Department for Energy Security and Net Zero, Department for Environment, Food & Rural Affairs & Department for Business, Energy & Industrial Strategy. (2013, last updated March 2019). Environmental Reporting Guidelines: Including Mandatory Greenhouse Gas Emissions Reporting Guidance (Ref: PB13944). UK Government.
World Resources Institute & World Business Council for Sustainable Development. (2011). Corporate Value Chain (Scope 3) Accounting and Reporting Standard. Washington, DC: Greenhouse Gas Protocol (GHG Protocol).
World Resources Institute & World Business Council for Sustainable Development. (revised edition). GHG Protocol Corporate Accounting and Reporting Standard. Washington, DC: Greenhouse Gas Protocol.

5. Current Emissions and Intensity Metrics Reporting
| Current Details | |
|---|---|
| Current Year: | 2025 |
| Baseline Year: | 2024 |
| Additional Details (relating to Baseline Emissions calculations): | |
Exclusions & Notes:
Notes:
| |
| Total tCO2e | Total tCO2e by £1m Turnover | Total tCO2e per Employee |
|---|---|---|
| 67.43 | 1.43 | 0.73 (Number of Employees – ~93) |
| Scope & Category | Source | tCO2e | |
|---|---|---|---|
| Scope 1 | Buildings – Gas | 1.47 | |
| Scope 1 | Buildings – F Gas | 0.00 | |
| Scope 1 | Vehicle Fleet | 0.00 | |
| Scope 2 | Electricity & Steam Heating / Cooling | 8.07 | |
| Scope 3 | Category 3 | Energy not in Scopes 1 & 2 | 3.36 |
| Scope 3 | Category 4 | Upstream Transport & Distribution | 16.44* |
| Scope 3 | Category 5 | Operational Waste, Wastewater & Water | 0.00* |
| Scope 3 | Category 6 | Business Travel | 0.00* |
| Scope 3 | Category 7 | Employee Commuting & Remote Working | 38.07* |
| Scope 3 | Category 9 | Downstream Transport & Distribution | 0.00* |
| Total tCO2e | 67.43 | ||
| *See the Current Details table for further information | |||
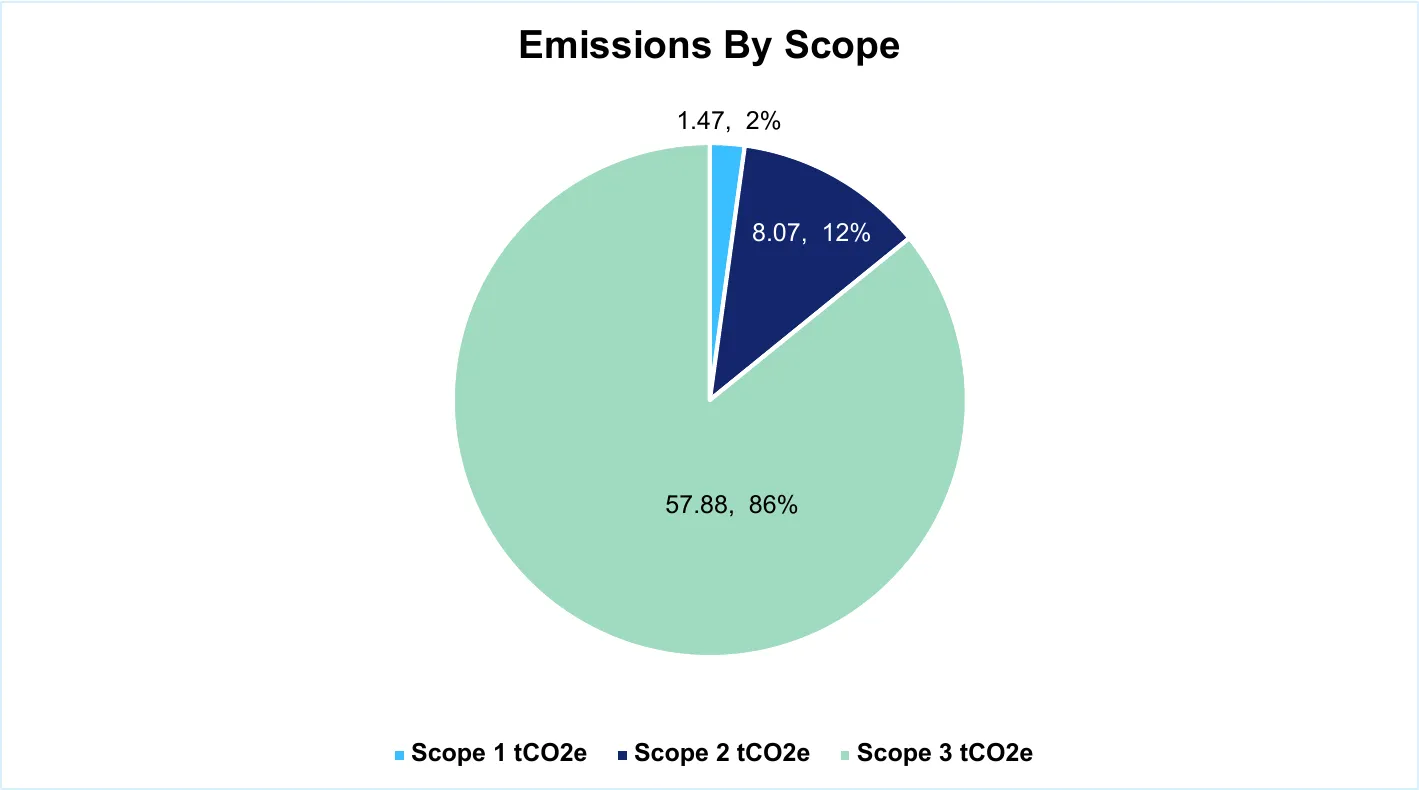
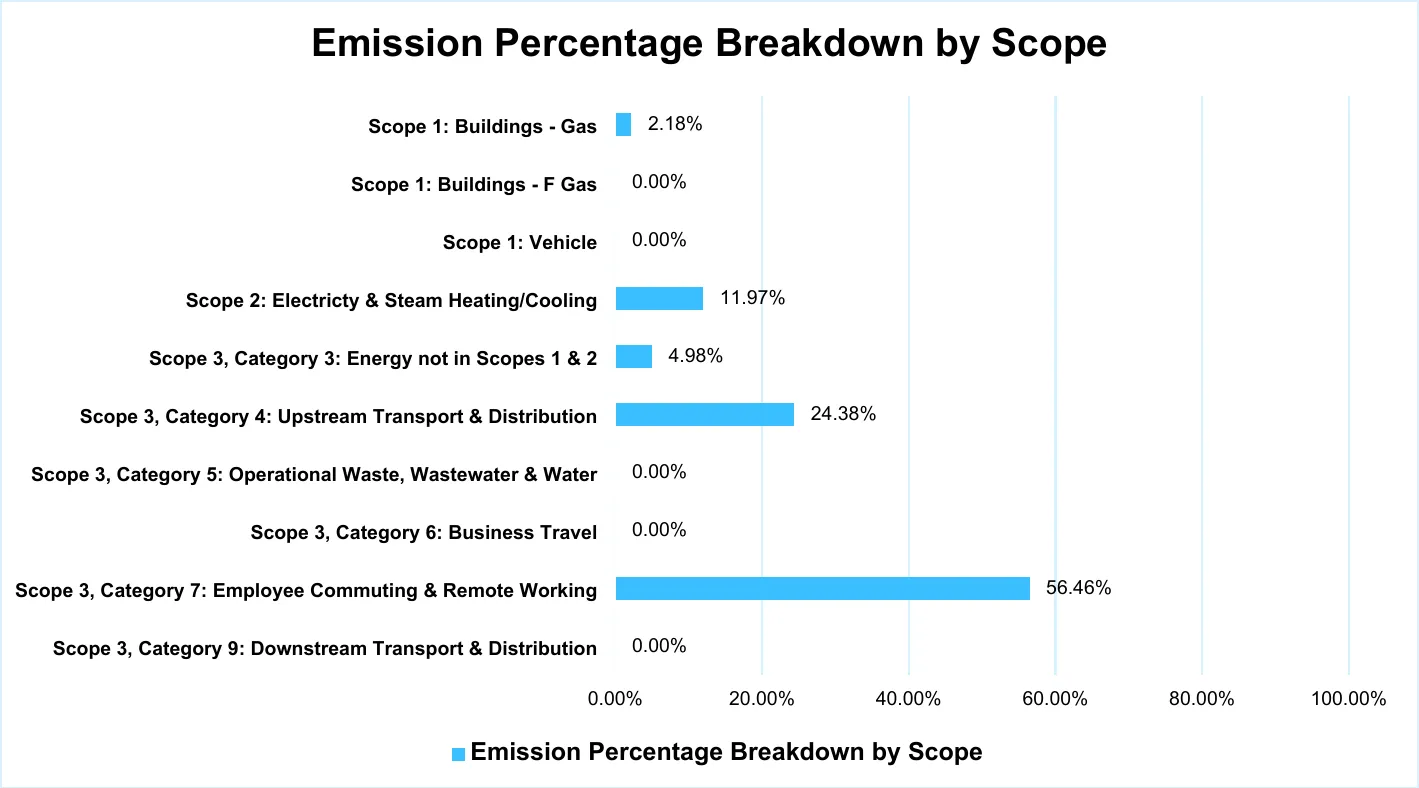
Note: Due to rounding, small variations may occur in the calculated figures.
6. Baseline Emissions Footprint (2024)
| Baseline Details | |||
|---|---|---|---|
| Baseline Year: | 2024 | ||
| Total Emissions: | 50.45 tCO2e | ||
| Emissions Breakdown | |||
| Scope / Category | Source | tCO2e | |
| Scope 1 | Buildings – Gas | 1.91 | |
| Scope 1 | Buildings – F Gas | 0.00 | |
| Scope 1 | Vehicle Fleet | 0.00 | |
| Scope 2 | Electricity & Steam Heating / Cooling | 7.81 | |
| Scope 3 | Category 3 | Energy not in Scopes 1 & 2 | 2.89 |
| Scope 3 | Category 4 | Upstream Transport & Distribution | 16.31 |
| Scope 3 | Category 5 | Operational Waste, Wastewater & Water | 0.03 |
| Scope 3 | Category 6 | Business Travel | 0.00 |
| Scope 3 | Category 7 | Employee Commuting & Remote Working | 21.50 |
| Scope 3 | Category 9 | Downstream Transport & Distribution | 0.00 |
| Additional Details: | |||
Exclusions:
Notes:
| |||
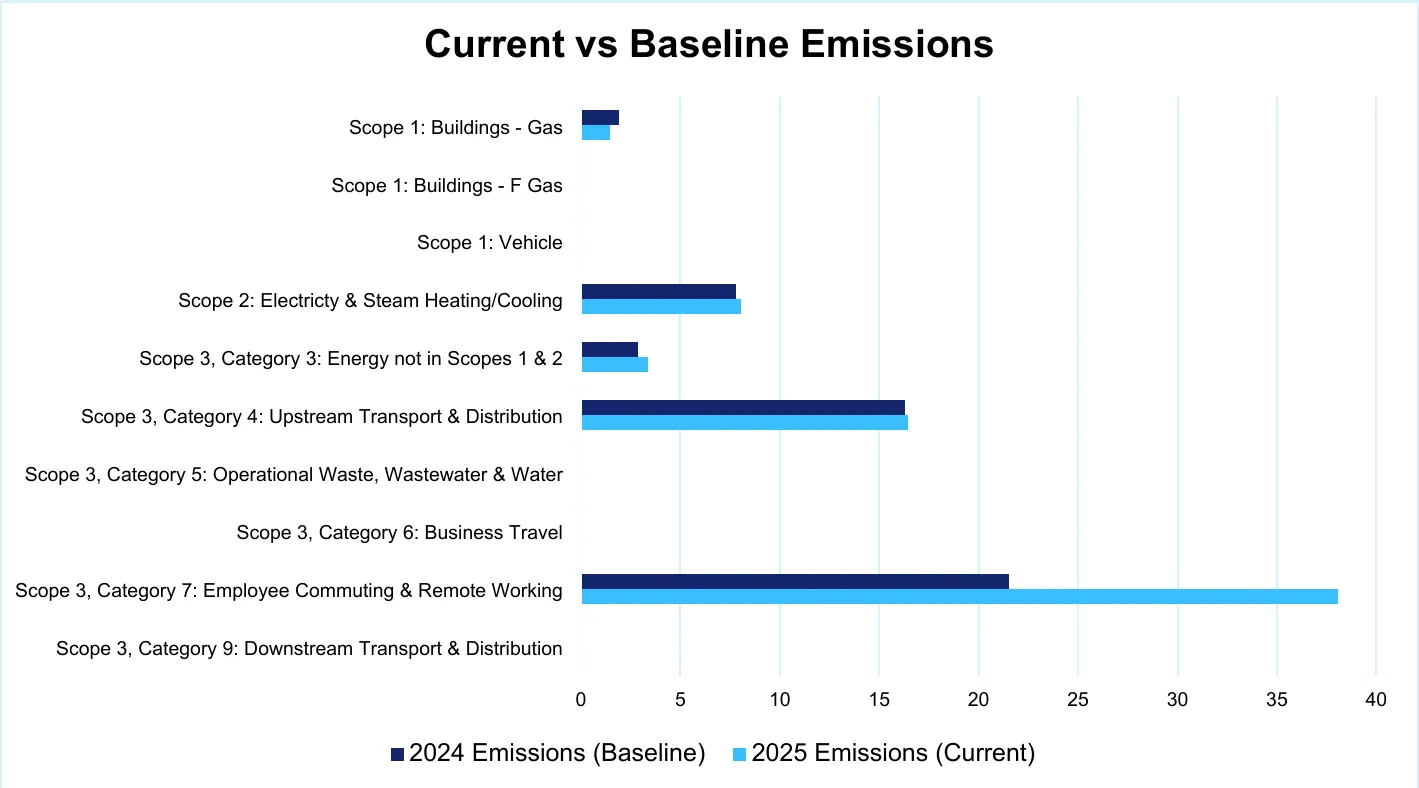
Note: Due to rounding, small variations may occur in the calculated figures.
7. Carbon Reduction Plan
7.1. Executive Summary
When we are looking at projects for carbon reduction and improvements to carbon and financial operations, we look at three key areas:
Capital Projects – Projects where new systems, equipment or technology are purchased and capitalised as a business asset to help reduce cost and carbon, e.g., solar power.
Procurement Projects – Projects where improving current supplier practices or changing suppliers or items purchased will improve cost or carbon performance.
Behavioural & Process Projects – Projects where changing the behaviour of staff within a company through education, awareness or involvement results in indirect cost and carbon improvements.
7.2. The Plan
PHP is continually improving its long-term strategic plan. One element of this plan is to demonstrate how the business will meet its Environmental, Social and Governance (ESG) obligations and the needs and wishes of its stakeholders.
A fundamental part of developing such a plan is gathering evidence with which to inform decision-making and direct future strategy. This project is part of that evidence-gathering process.
The results from this work will assist PHP to optimise sustainability, minimise emissions and maintain climate-related concerns as a core element of their strategic plans in the future.
A key focus in 2026 will be continuing to improve the data quality, both internal and from suppliers, and working with our supply chain to better understand our Scope 3 Category 4 & Scope 3 Category 9 emissions.

8. Emissions Reduction Targets
In order to continue our progress to achieving Net Zero, we have adopted the carbon reduction targets as indicated below.
The graphs below plot the reduction, based on the emissions detailed in this document, to meet the Net Zero target year of 2050. We have modelled it on the expectation that, as carbon reduction technology improves and can be adopted by the business, the percentage reduction each year will increase, and then, as the applicable new carbon reduction technology is adopted, the percentage reduction will decline.
This graph reflects the carbon reduction required to meet the Net Zero target date of 2050, based on the tCO₂e in the baseline year. This will be updated in future years to reflect the actual reduction.
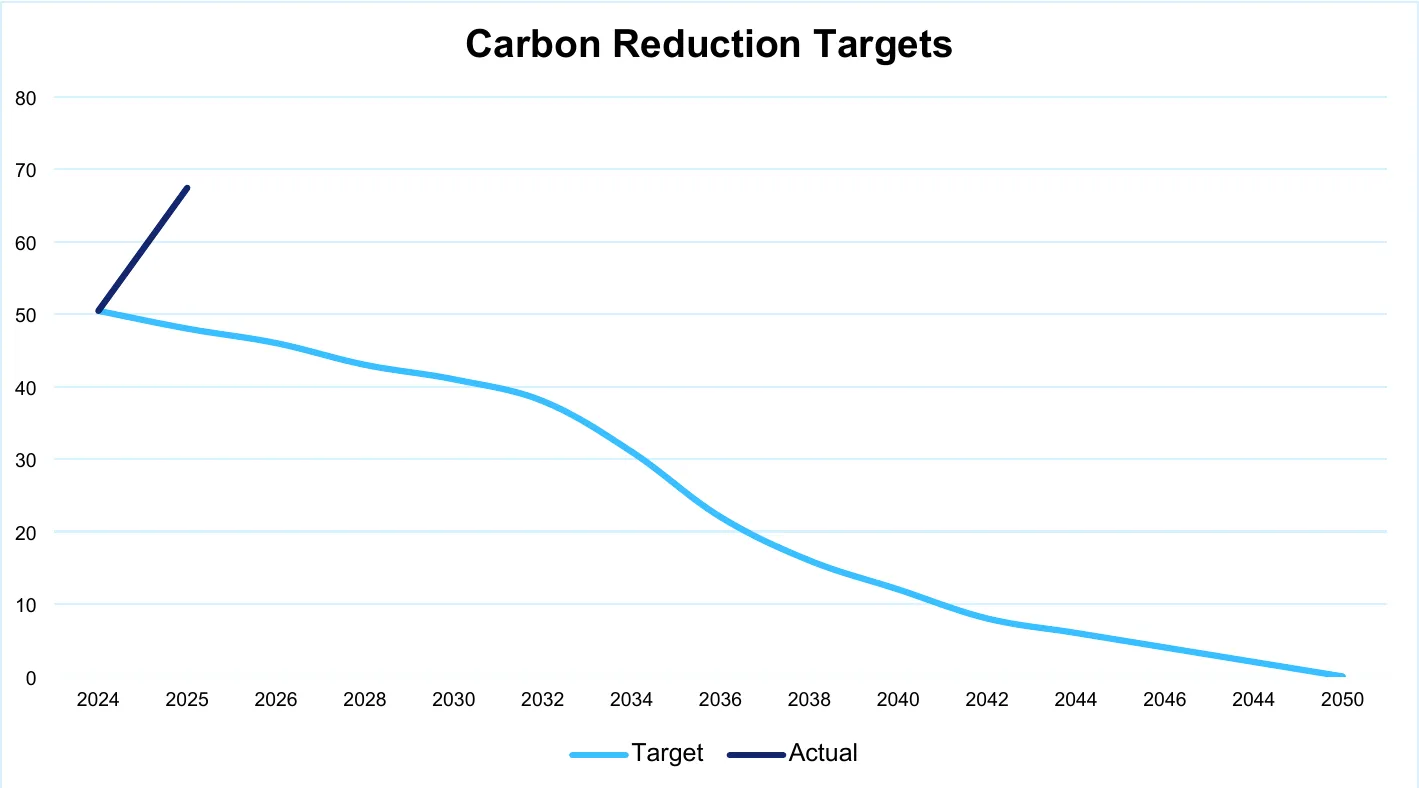
Note: Due to rounding, small variations may occur in the calculated figures.
9. Carbon Reduction Projects
| 2025 Delivered and Ongoing Projects | |
|---|---|
| Capital Projects | |
Ongoing: Digital Prescribing & Paperless Operations Increased use of electronic prescribing, digital records, and IT systems to minimise paper use and physical transport of prescriptions. | So far, moving paperless has saved: approximately 114kg of paper per month. Annually, this equates to approximately:
|
Ongoing: Process Automation and IT Optimisation Automation of auditing, reporting, and operational workflows to reduce rework, printing, and travel (e.g. use of virtual audits). | |
| Procurement Projects | |
Ongoing: Vendor Onboarding Integration of Net Zero considerations into Vendor Selection and Management process. | This involves considering the vendor’s Net Zero commitments and Carbon Reduction Plans. |
| Behavioural & Process Projects | |
Delivered: Remote & Hybrid Working Increased use of hybrid and remote working, where operationally feasible, to reduce employee commuting emissions. | PHP emissions have risen since 2024; this is due to the rapid expansion occurring within the company. We currently have around double the employees than this time last year, yet our tCO2e has reduced from 1.03 tCO2e per employee in 2024 to 0.73 tCO2e per employee in 2025! |
| 2026 Planned Projects | |
|---|---|
| Capital Projects | |
Office Move Ensure energy efficiency is a high priority in designing/specifying new office systems and layout. | Electronic Vehicle (EV) Charging Points Implement EV charging points on the new office site to encourage staff to utilise EVs and reduce carbon emissions via staff travel. |
Solar Panels Implement solar panels on the new office site to increase sustainable emergency use. | PHP-Owned Transport Using PHP-owned transport for local deliveries, where possible, to reduce upstream travel emissions and improve data quality. |
| Procurement Projects | |
Green Electricity Tariff Investigate a move to a 100% renewable electricity tariff for office operations. | Data Improvement Plan Formal engagement with key suppliers to improve upstream transport & logistics data and to understand their carbon reduction plans, e.g. transition to EV or hybrid vehicles. |
| Behavioural & Process Projects | |
Carpooling Introduce an internal carpooling service to reduce employee commuting emissions | |